Data Visualization
The Story
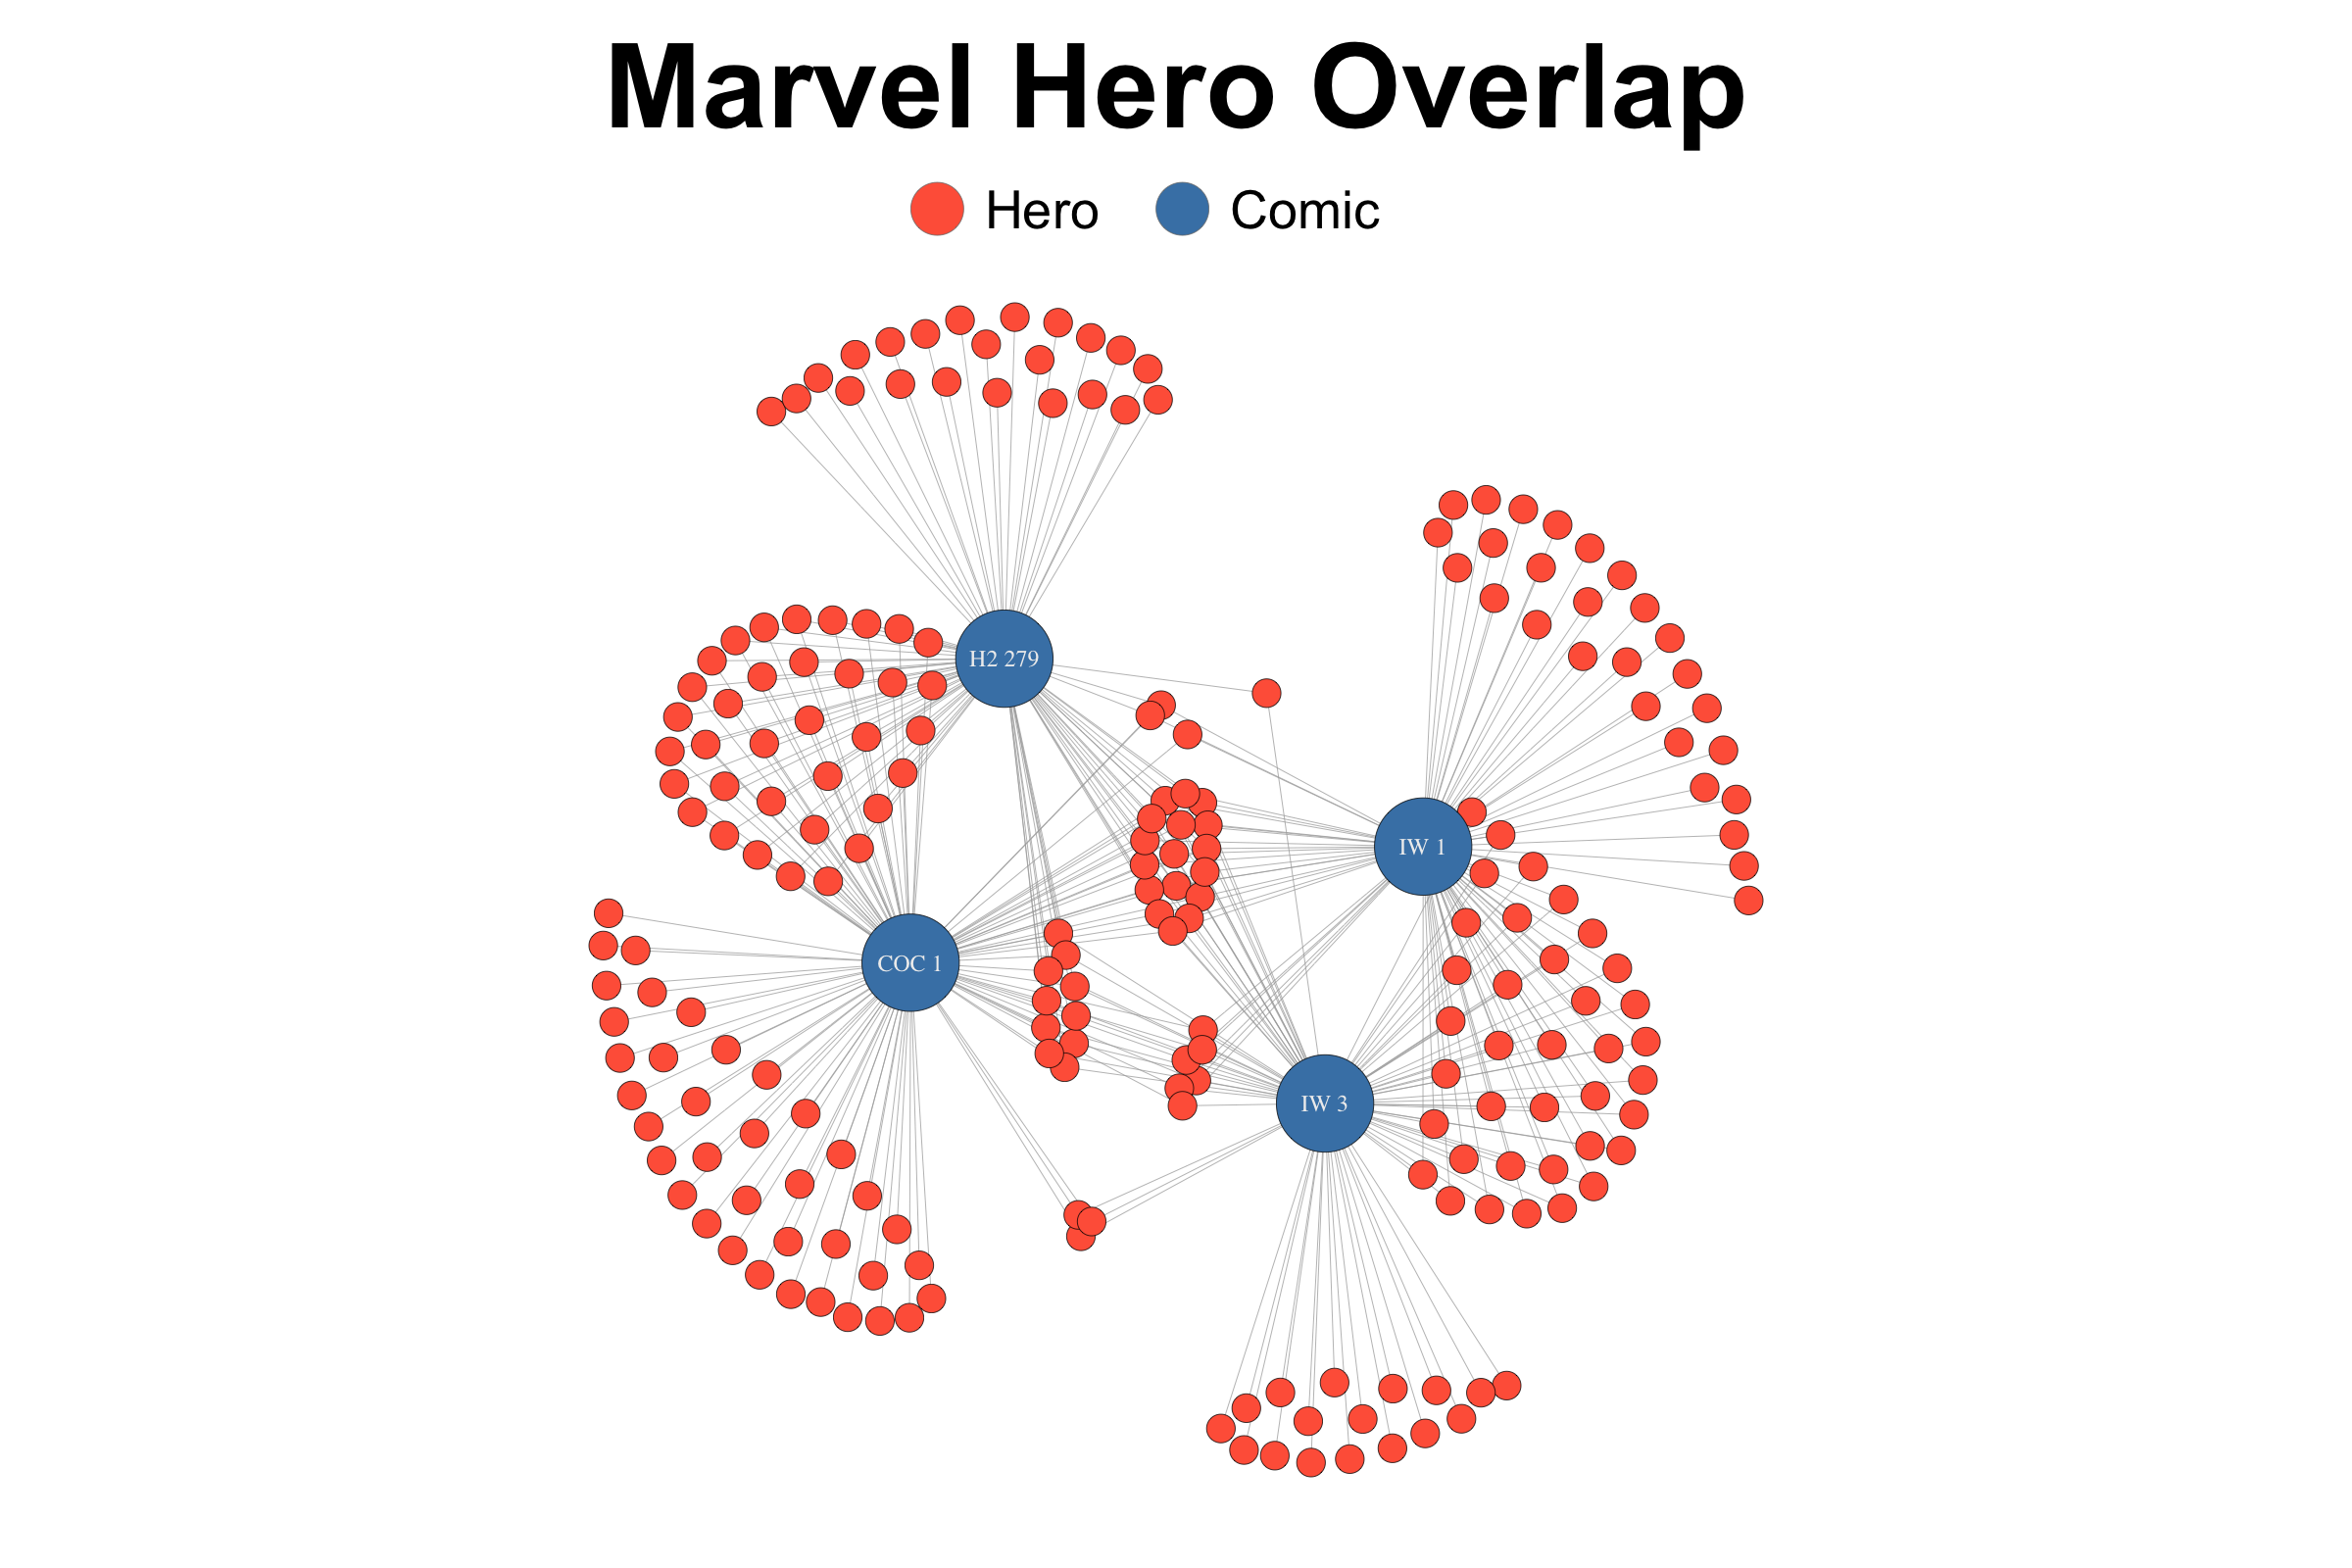
The Marvel Universe, as created by Marvel Comics, includes thousands of heroes. While many of these heroes appear in hundreds of comics, some appear only a handful of times. So when analyzing the Marvel Universe, how might one begin to understand which heroes are the most central to the universe? The above network graph, presents the four Marvel comics containing the largest number of heroes, each having over 80. These comics are (from top left clockwise) “Incredible Hulk #279”, “Invisible Woman 1”, “Invisible Woman 3”, and “Contest of Champions 1”. Despite these comics containing a combined 215 heroes, only 17 appear in all four. Further, there are a significant number of heroes who appear only in one of these comics. While, this graph doesn’t represent the entirety of the Marvel Universe, it does begin to give us an indication as to which characters are most central. Many of these central heroes (listed below) have been featured in recent Marvel movies. Perhaps we can expect the rest to be featured in upcoming blockbuster releases.
- Vision
- Spider-Man
- Scarlet Witch
- Quicksilver
- Captain America
- Wonder Man
- Wolverine
- Storm
- Angel
- Beast
- Dr. Strange
- Crystal
- Iceman
- Colossus II
- Sasquatch
- Aurora
- Northstar
The Reflection
First of all, I was very happy I was able to present a visualization of a network. I am even more happy I was able to augment my submission from the fourth data visualization challenge by presenting the union of four ego networks. This involved a significant amount of data manipulation and understanding the data structures used to implement networks and generate ego networks. I am very happy with how my data wrangling and ability to simply present a story worth sharing.
However, one thing I would like to do is add more comics to this graph. I believe this would provide the opportunity to see who the most central characters to the Marvel universe are, rather than just the connections between these seemingly distinct comics. Further, I would be interested in developing this into an interactive visualization, were hovering over a node would display information such as hero or comic name. I believe this would provide very valuable information, allowing viewers to understand the graph more completely.
The Process
For this graph, I used the Marvel graph.ml file provided during the final data challenge for INTEG 375. The first thing my group and I did when creating the predecessor of this graph, was to spend a significant amount of time exploring the dataset. Through this exploration we were able to familiarize ourselves with the data structures which were used to store the network, as well as what this dataset represented. We soon realized this was a massive hairball network, and tried to think of interesting ways we might simplify and extract a story. We decided to try to find a way to combine the ego networks of a couple of the comics which contained lots of heroes, our hope was that this would allow us to identify which heroes are most central to the marvel universe. The graph which we presented as our data visualization contained a combination of only two ego networks. My iteration on this added two more, presenting a more interesting visualization for viewers. The process I describe below is for the final iteration of this graph, which was much more elegant than the initial process.
To help with the mess which I found occurs with merging igraphs, I began by removing all vertex attributes which I wasn’t presenting in my network (many of which had identical values). Then I made a list of ego networks with the make_ego_graph function. I chose to include only those comics which had a degree above 80, as from previous research told me these would be the largest four ego networks. After this I created a graph for each ego network (e1, e2, e3, e4), extracting them from their respective index in the ego list. Then to facilitate merging, I created a name attribute corresponding to the id of the vertices. Then, in my next step I was able to simply merge them with the %u% operator, which naturally joined them on the name attribute. I first merged the first and second ego networks to create g1. Merging doubled each attribute, adding a suffix to the original attribute name (ie. instead of merging e1 and e2’s label attributes, it creates a label_1 and label_2 attribute). Thus, I manually merged label_1 & label_2 as well as id_1 & id_2, creating label and id respectively. This meant I was able to remove the old labels (ex. label_1), simplifying the graph once again.
I then followed this same procedure to merge e2 and e3 to create g2. Afterwards, I was able to use the same steps, merging g1 and g2 to create g. This final graph g, contained 219 vertices (4 comics, 215 heroes) and 379 edges.
Once I had the network structure set up, I was able to begin assigning visual attributes to the graph. I chose to have hero nodes be smaller and coloured differently than comic nodes. I also chose to only include labels for the comics. I then was able to plot the graph, altering aspects such as label and margin size and title placement. I also added a legend for this plot to inform viewers of which nodes were heroes and which were comics.
The Learning
This visualization presented me with a lot of challenges throughout its development. Thankfully, I was able to learn from these challenges later applying their lessons to new graphs. This was the first time I was able to successfully take a hairball network, conceptualize it, and create an interesting visualization from it.
Firstly, through the development of this graph I was able to learn more about the data structures which igraph objects are stored in. This was important for understanding how to understand and present igraph objects and networks, knowledge which became useful throughout this course and others. Most of this learning occurred as I was trying to determine how we might create, and merge ego networks. I began to understand how naming vertices, merging graphs, and generating ego networks worked. These were important lessons, which involved a significant amount of documentation research and experimentation.
library(igraph)
library(foreign)

marv <- read.graph("/Users/.../marvel.graphml.txt", format=c("graphml"))

marv <- marv %>%
  remove.vertex.attribute("r")%>%
  remove.vertex.attribute("g")%>%
  remove.vertex.attribute("b")%>%
  remove.vertex.attribute("x")%>%
  remove.vertex.attribute("y")%>%
  remove.vertex.attribute("size")%>%
  remove.edge.attribute("Edge Label")%>%
  remove.edge.attribute("Edge Id")%>%
  remove.edge.attribute("weight")

ego <- make_ego_graph(marv, 1, nodes =
                        which((V(marv)$label == "comic") &
                                (degree(marv)>80)))

e1 <- first(ego[1])
e2 <- first(ego[2])
e3 <- first(ego[3])
e4 <- first(ego[4])


V(e1)$name <- V(e1)$id
V(e2)$name <- V(e2)$id
V(e3)$name <- V(e3)$id
V(e4)$name <- V(e4)$id

g1 <- e1 %u% e2
V(g1)$label = ifelse((is.na(V(g1)$label_1)),
                     V(g1)$label_2,
                     V(g1)$label_1)
V(g1)$id = ifelse((is.na(V(g1)$id_1)),
                  V(g1)$id_2,
                  V(g1)$id_1)
g1 <- g1 %>%
  remove.vertex.attribute("label_1") %>%
  remove.vertex.attribute("label_2") %>%
  remove.vertex.attribute("id_1") %>%
  remove.vertex.attribute("id_2")

g2 <- e3 %u% e4
V(g2)$label = ifelse((is.na(V(g2)$label_1)),
                     V(g2)$label_2,
                     V(g2)$label_1)
V(g2)$id = ifelse((is.na(V(g2)$id_1)),
                  V(g2)$id_2,
                  V(g2)$id_1)
g2 <- g2 %>%
  remove.vertex.attribute("label_1") %>%
  remove.vertex.attribute("label_2") %>%
  remove.vertex.attribute("id_1") %>%
  remove.vertex.attribute("id_2")

g <- g1 %u% g2
V(g)$label = ifelse((is.na(V(g)$label_1)),
                    V(g)$label_2,
                    V(g)$label_1)
V(g)$id = ifelse((is.na(V(g)$id_1)),
                 V(g)$id_2,
                 V(g)$id_1)
g <- g %>%
  remove.vertex.attribute("label_1") %>%
  remove.vertex.attribute("label_2") %>%
  remove.vertex.attribute("id_1") %>%
  remove.vertex.attribute("id_2")


V(g)$size  = ifelse(V(g)$label == "hero",
                    5, 17)
V(g)$color = ifelse(V(g)$label == "hero",
                    "tomato", "steelblue")
V(g)$label = ifelse(V(g)$label == "hero",
                    NA, V(g)$id)


png(filename="Marvel.png", height=1600, width=2400)
par(mar=c(0,0,3,0) + 0.5)
par(oma=c(0,0,12,0))
plot(g,
     layout = layout_with_kk(g),
     vertex.label.color = "#EEEEEE",
     vertex.label.cex = 2)
title(main = list("Marvel Overlap", cex = 10),
      outer = TRUE)
legend(x=-0.5, y=1.3,
       c("Hero","Comic"),
       pch=21, cex=4.5,
      col="#777777",
      pt.bg=c("tomato", "steelblue"),
      pt.cex=10,
      bty="n", ncol=2)
dev.off()