Data Visualization
Throughout my participation in INTEG 375, a course on Data Visualization, at the University of Waterloo, I gained various insight in creating informative and thought-provoking visualizations. This portfolio highlights the work that best represents the knowledge and experience I have gained from this course.
- Jillian Anderson
The Visualizations
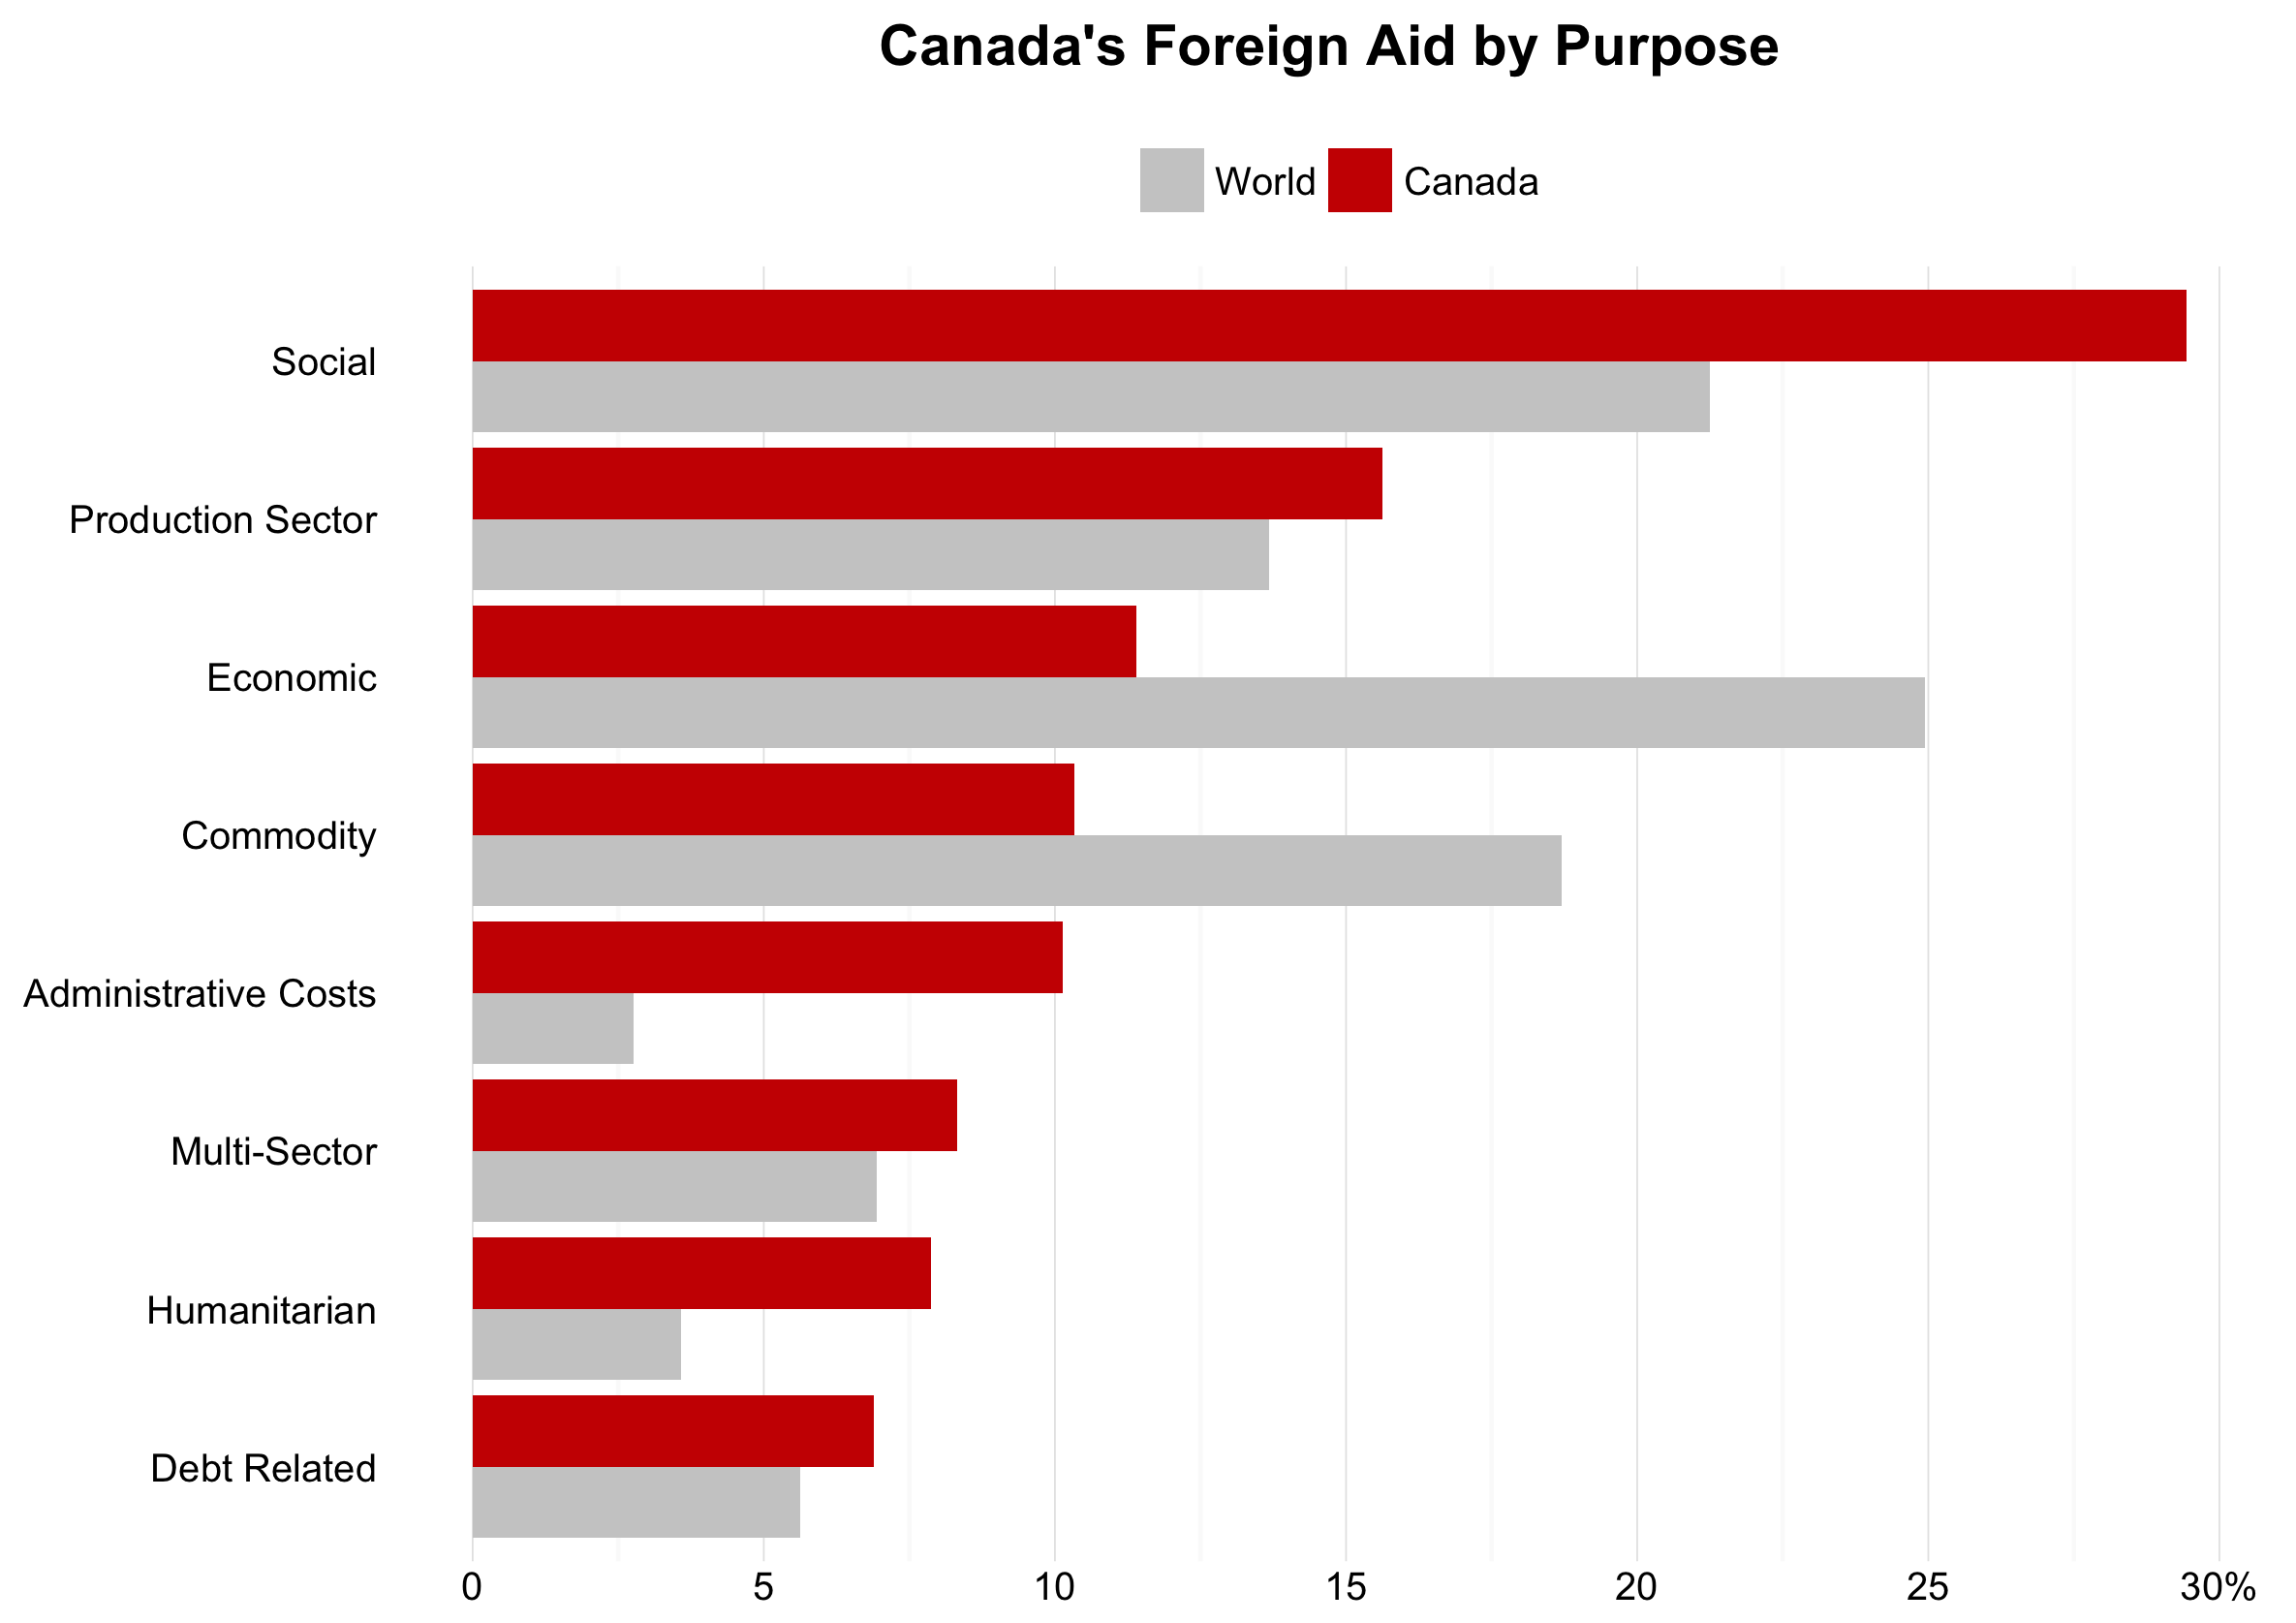
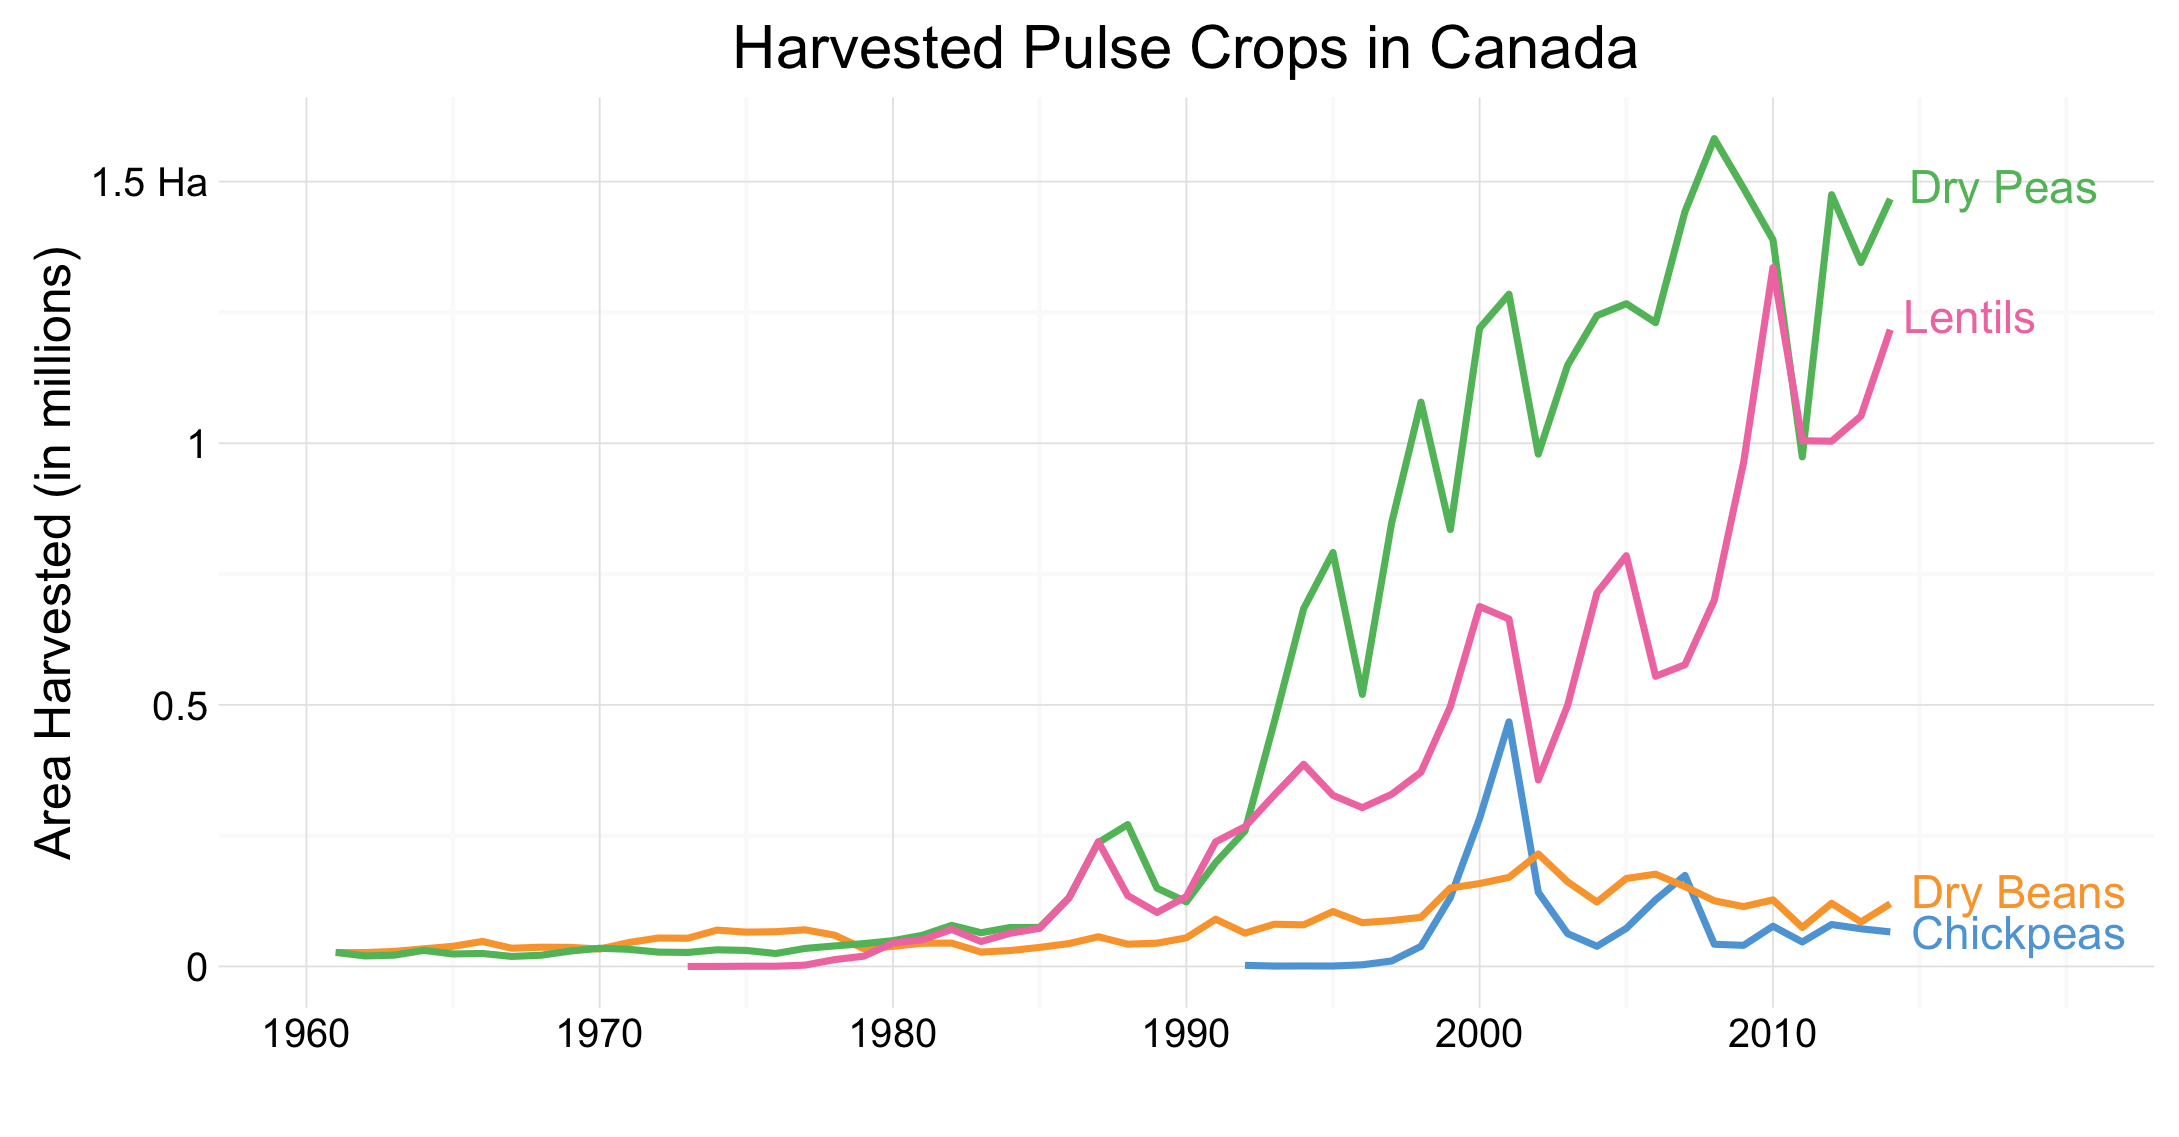
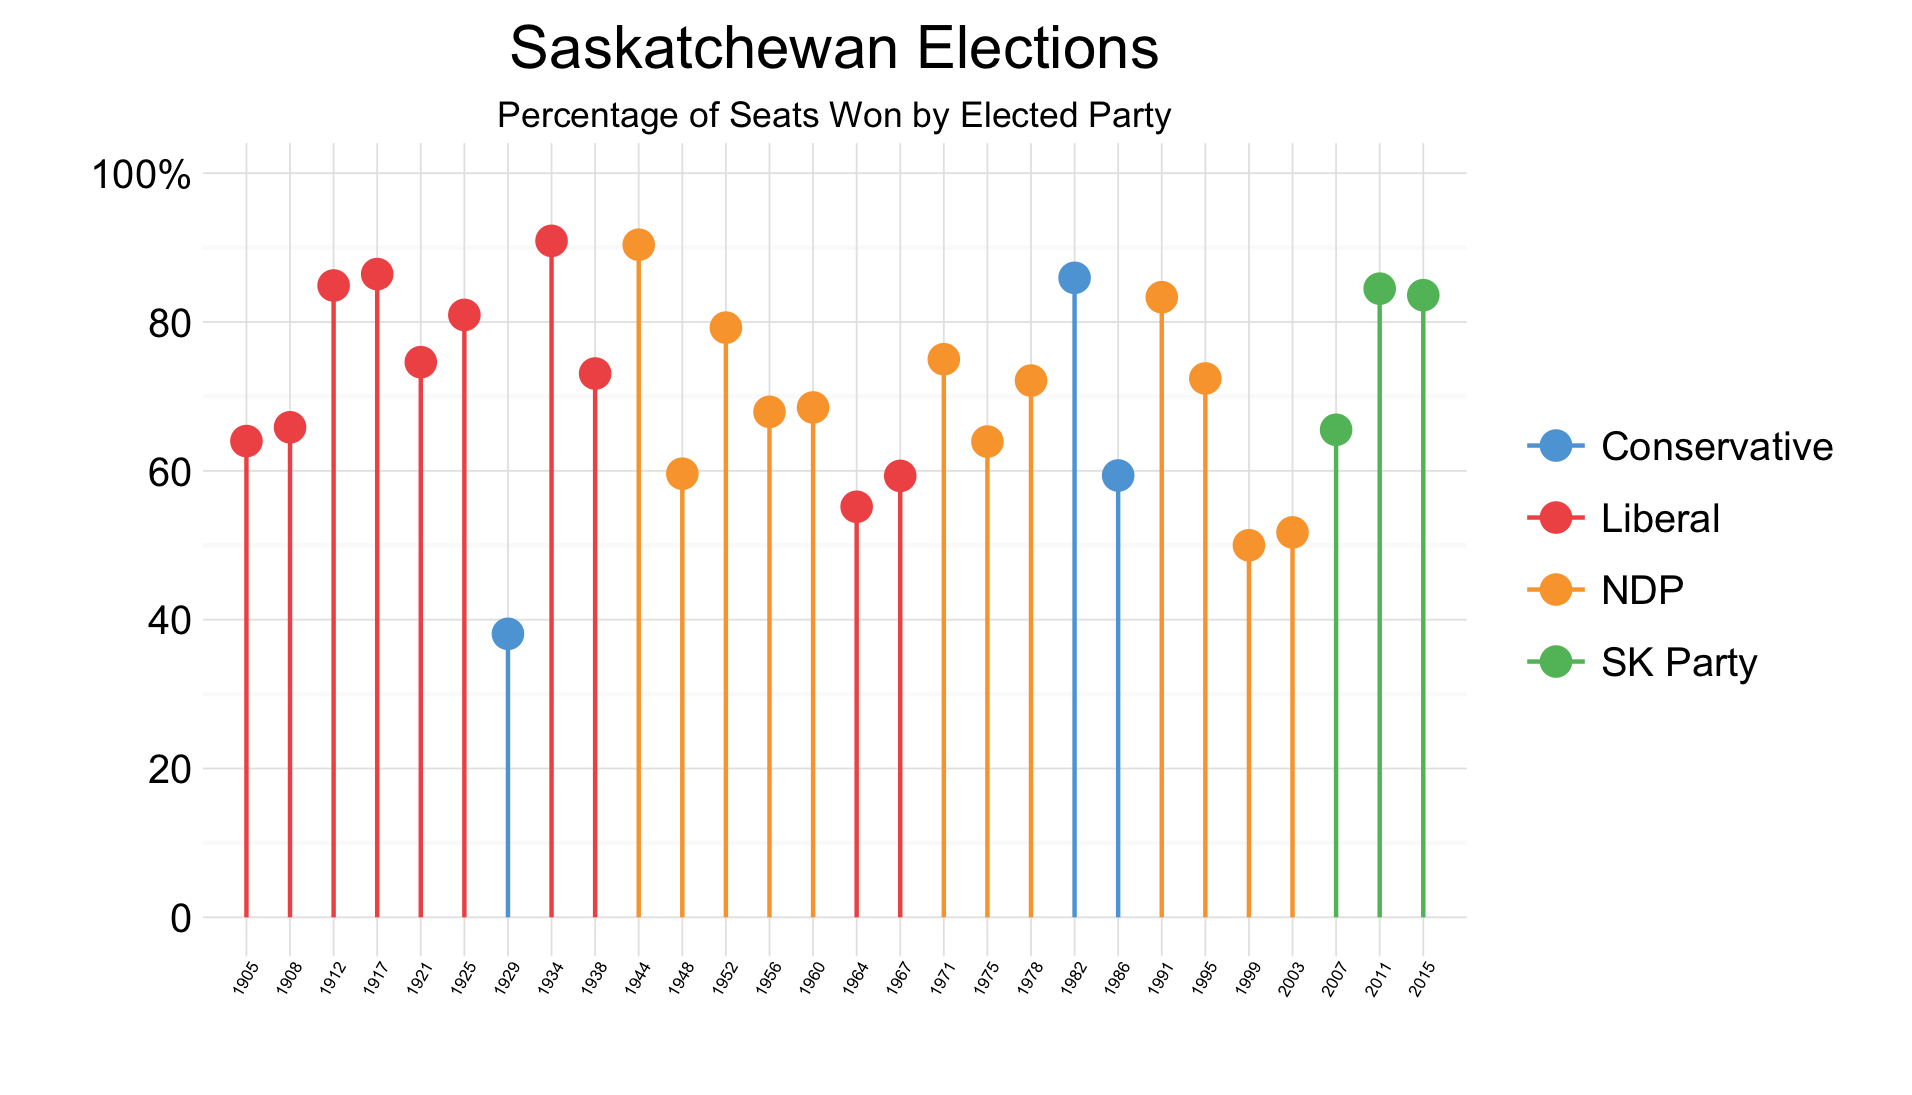
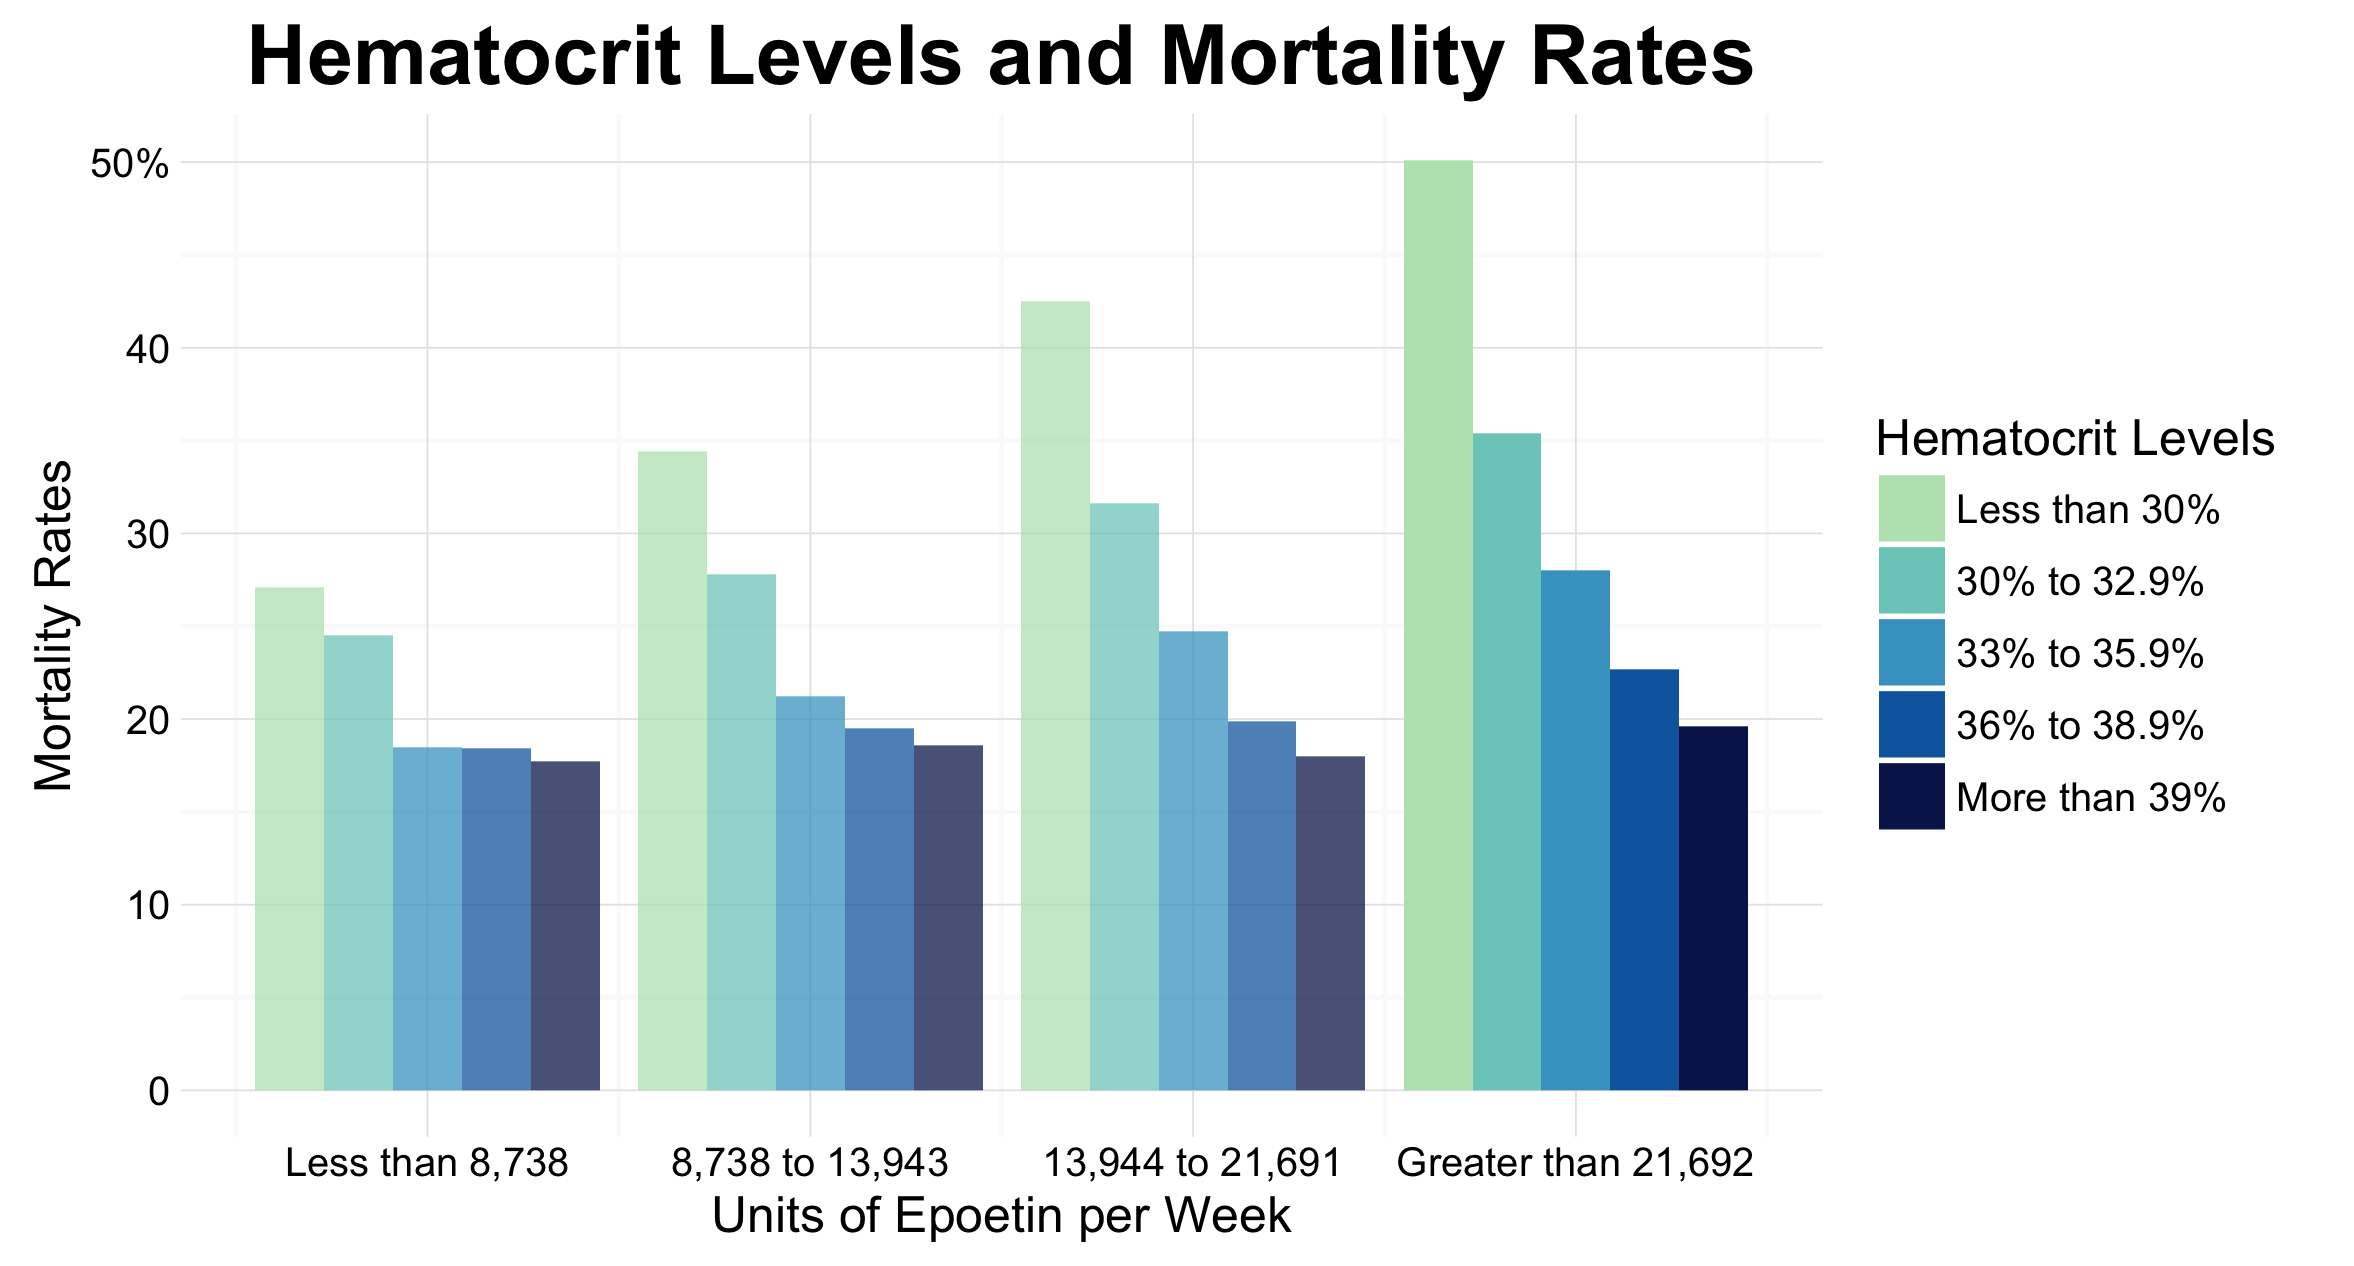
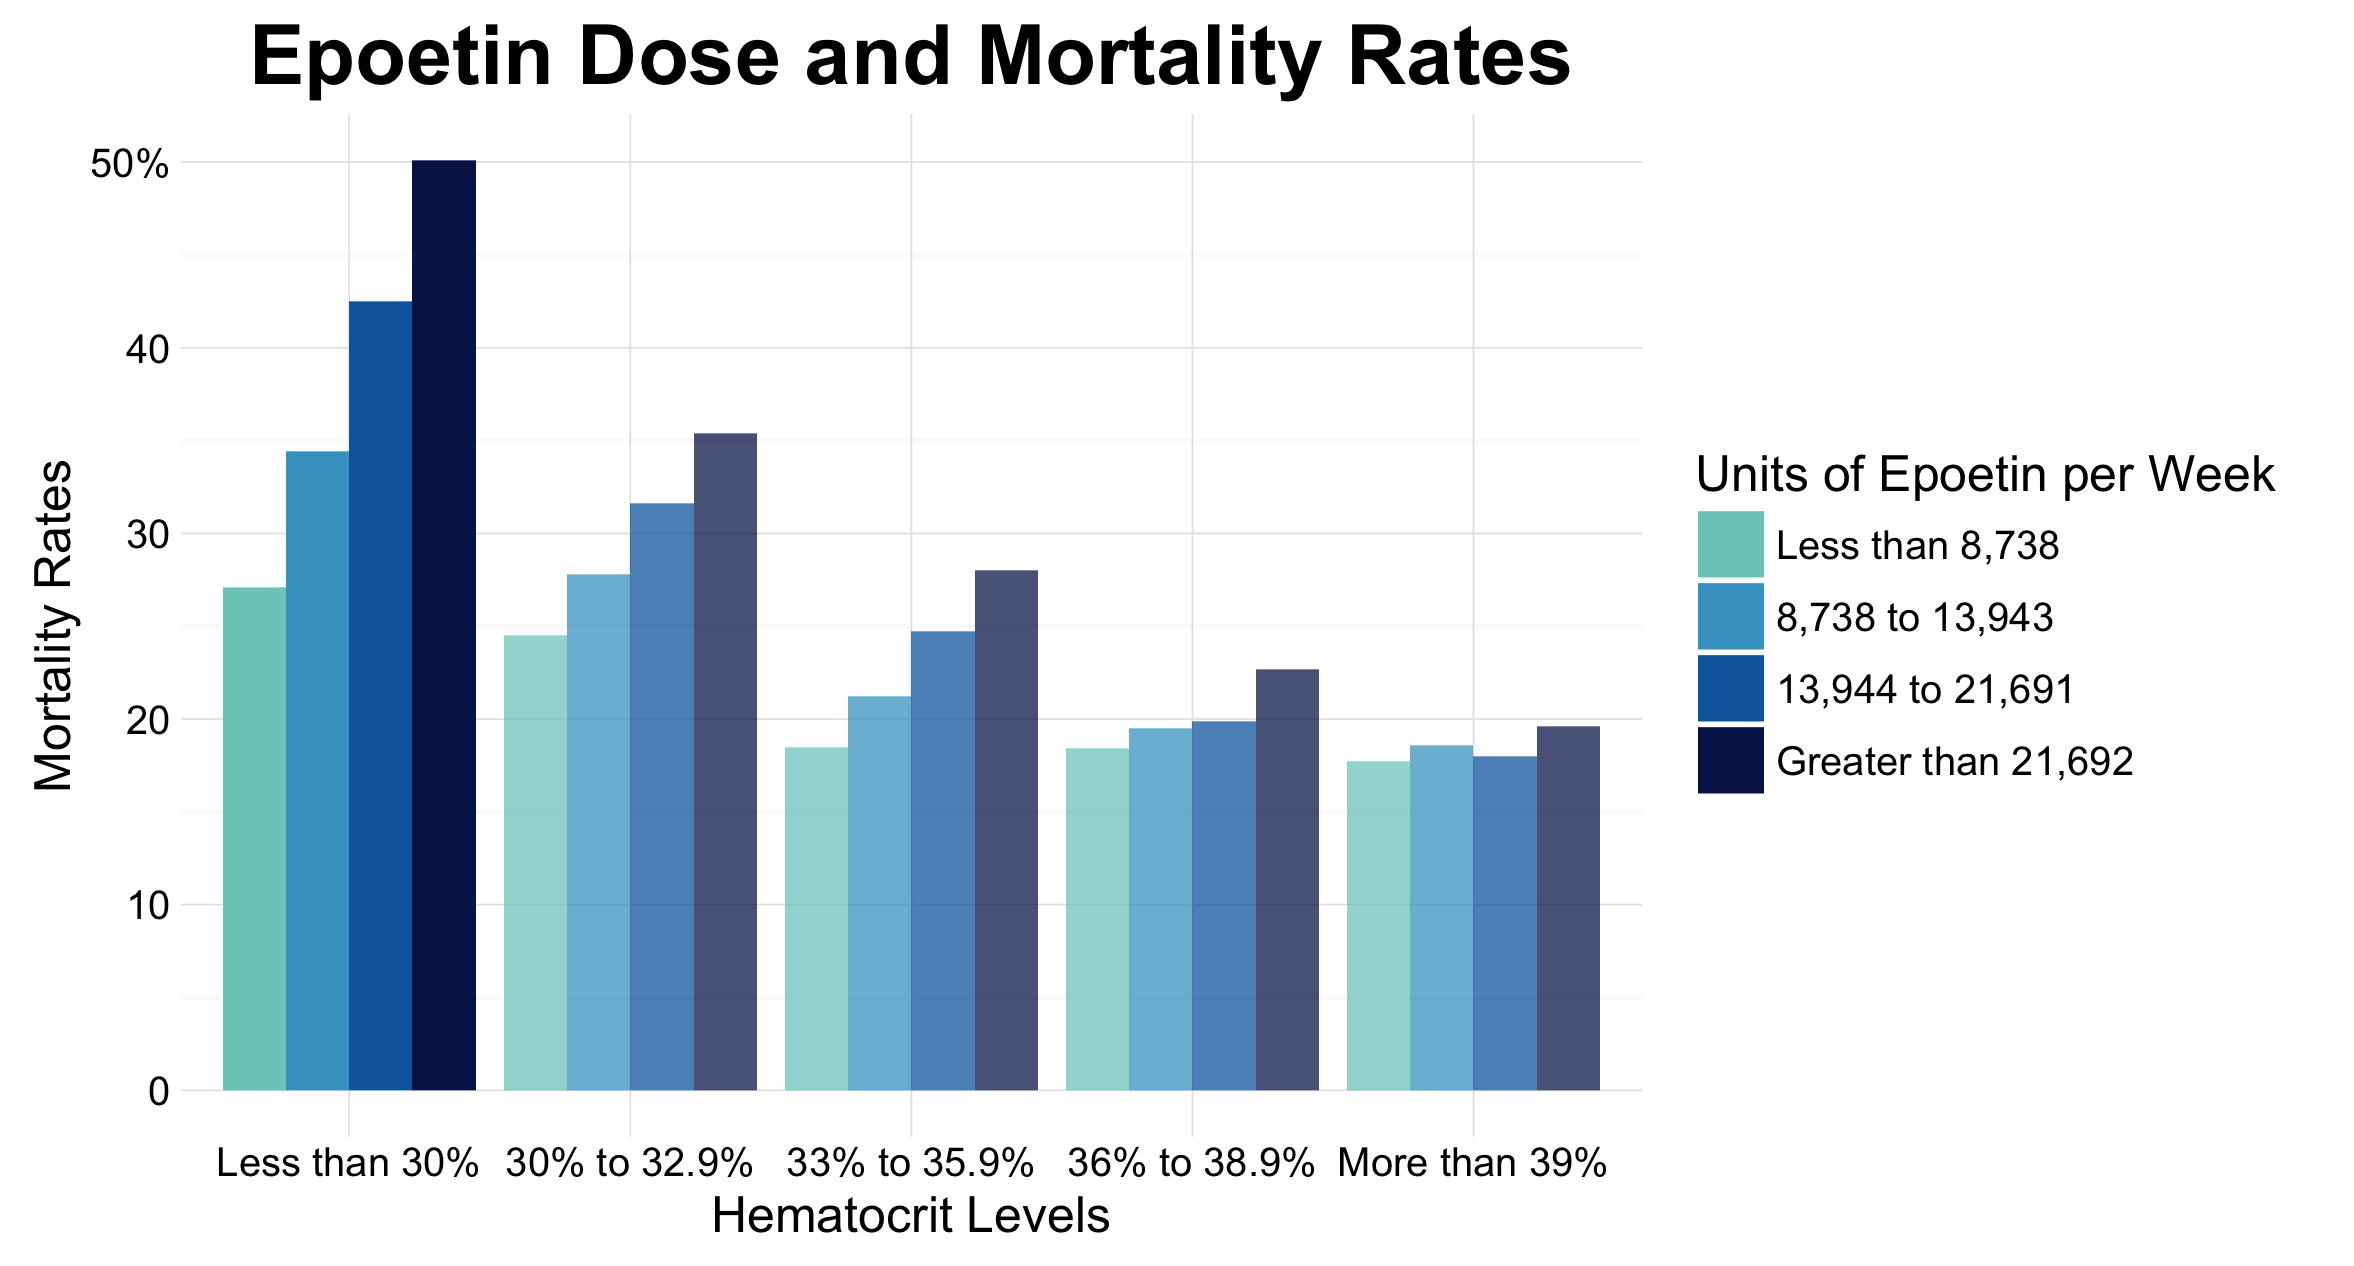
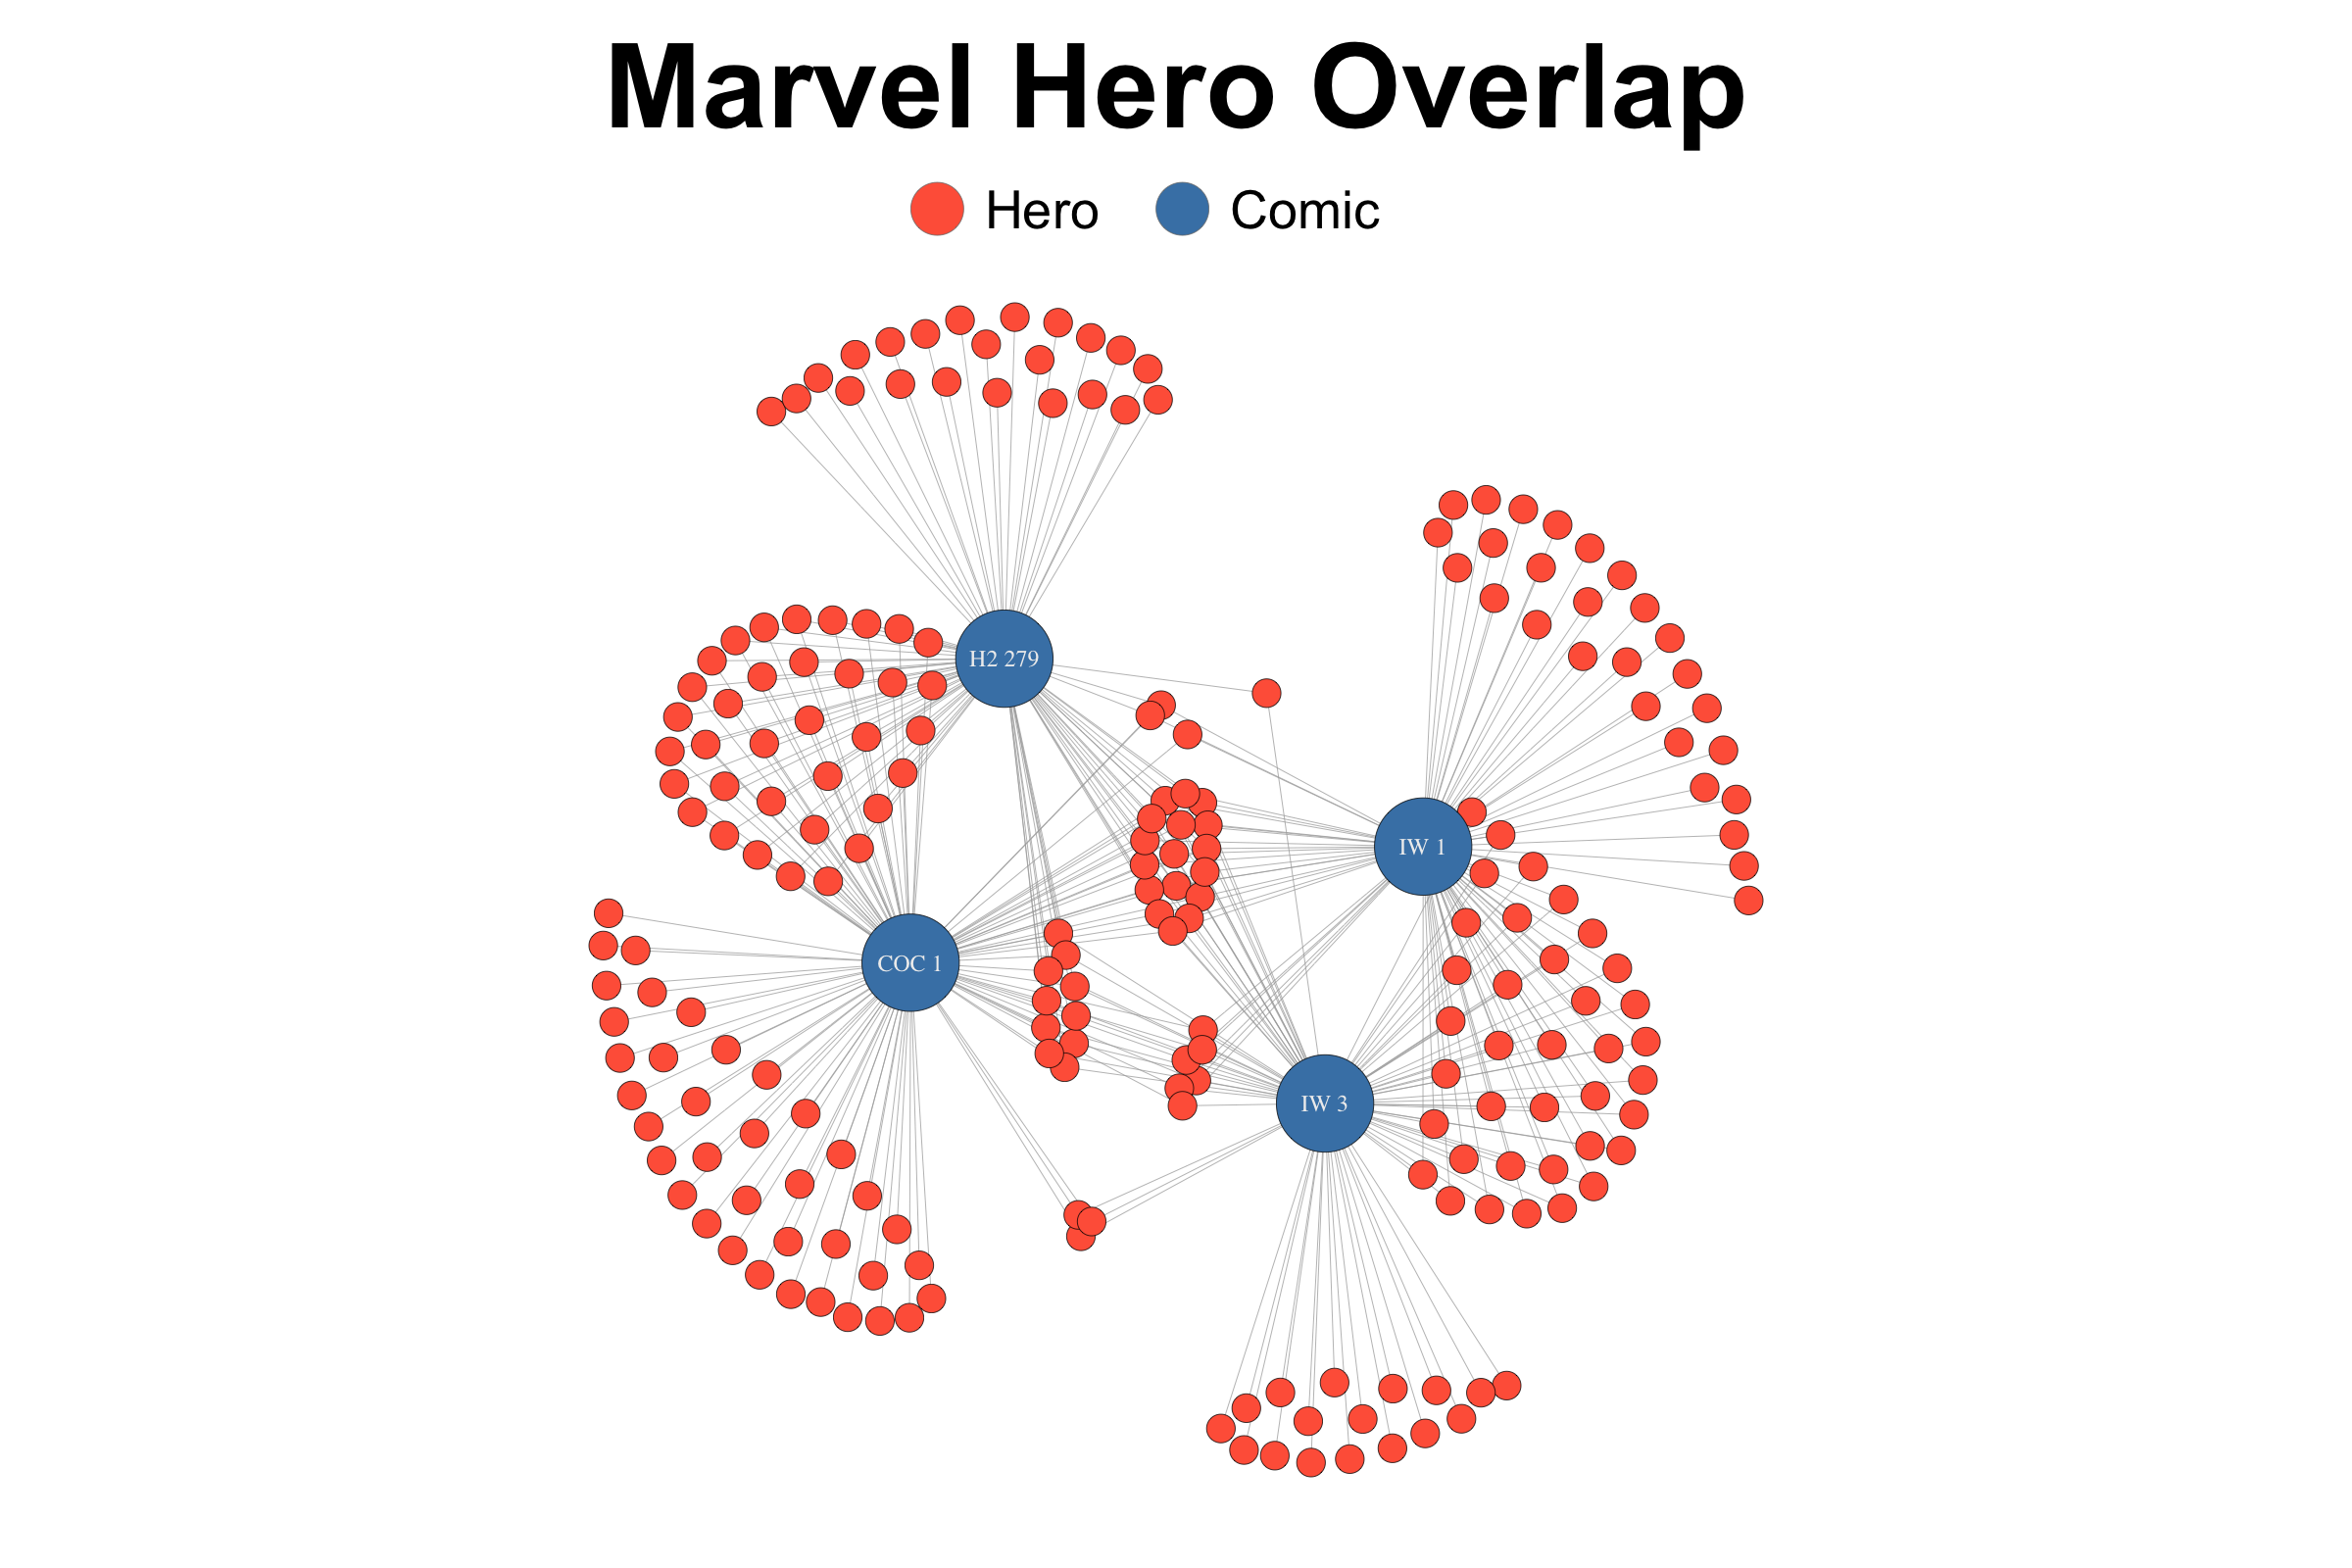
Below you can find 14 sections, containing a total of 15 visualizations, presenting information regarding topics from air travel to foreign aid, poverty to trains, and politics to comic books. Each section contains the visualization(s) paired with a discussion meant to tell a story surrounding the visualization. Accompanying these pieces are reflections, lessons learned, R code and detailed descriptions of the process of creating the visualizations.
All these visualizations were produced in R, using libraries such as ggplot21, dpylr2, igraph3, reshape24, and foreign5. Much of the design has been informed by Stephen Few’s “Show Me the Numbers”6, a read I recommend for anyone interested in data visualization. And while the data for each visualization is specifically referenced within its section, I would like to say most of this data has come from open source datasets, published academic papers, or government reports.
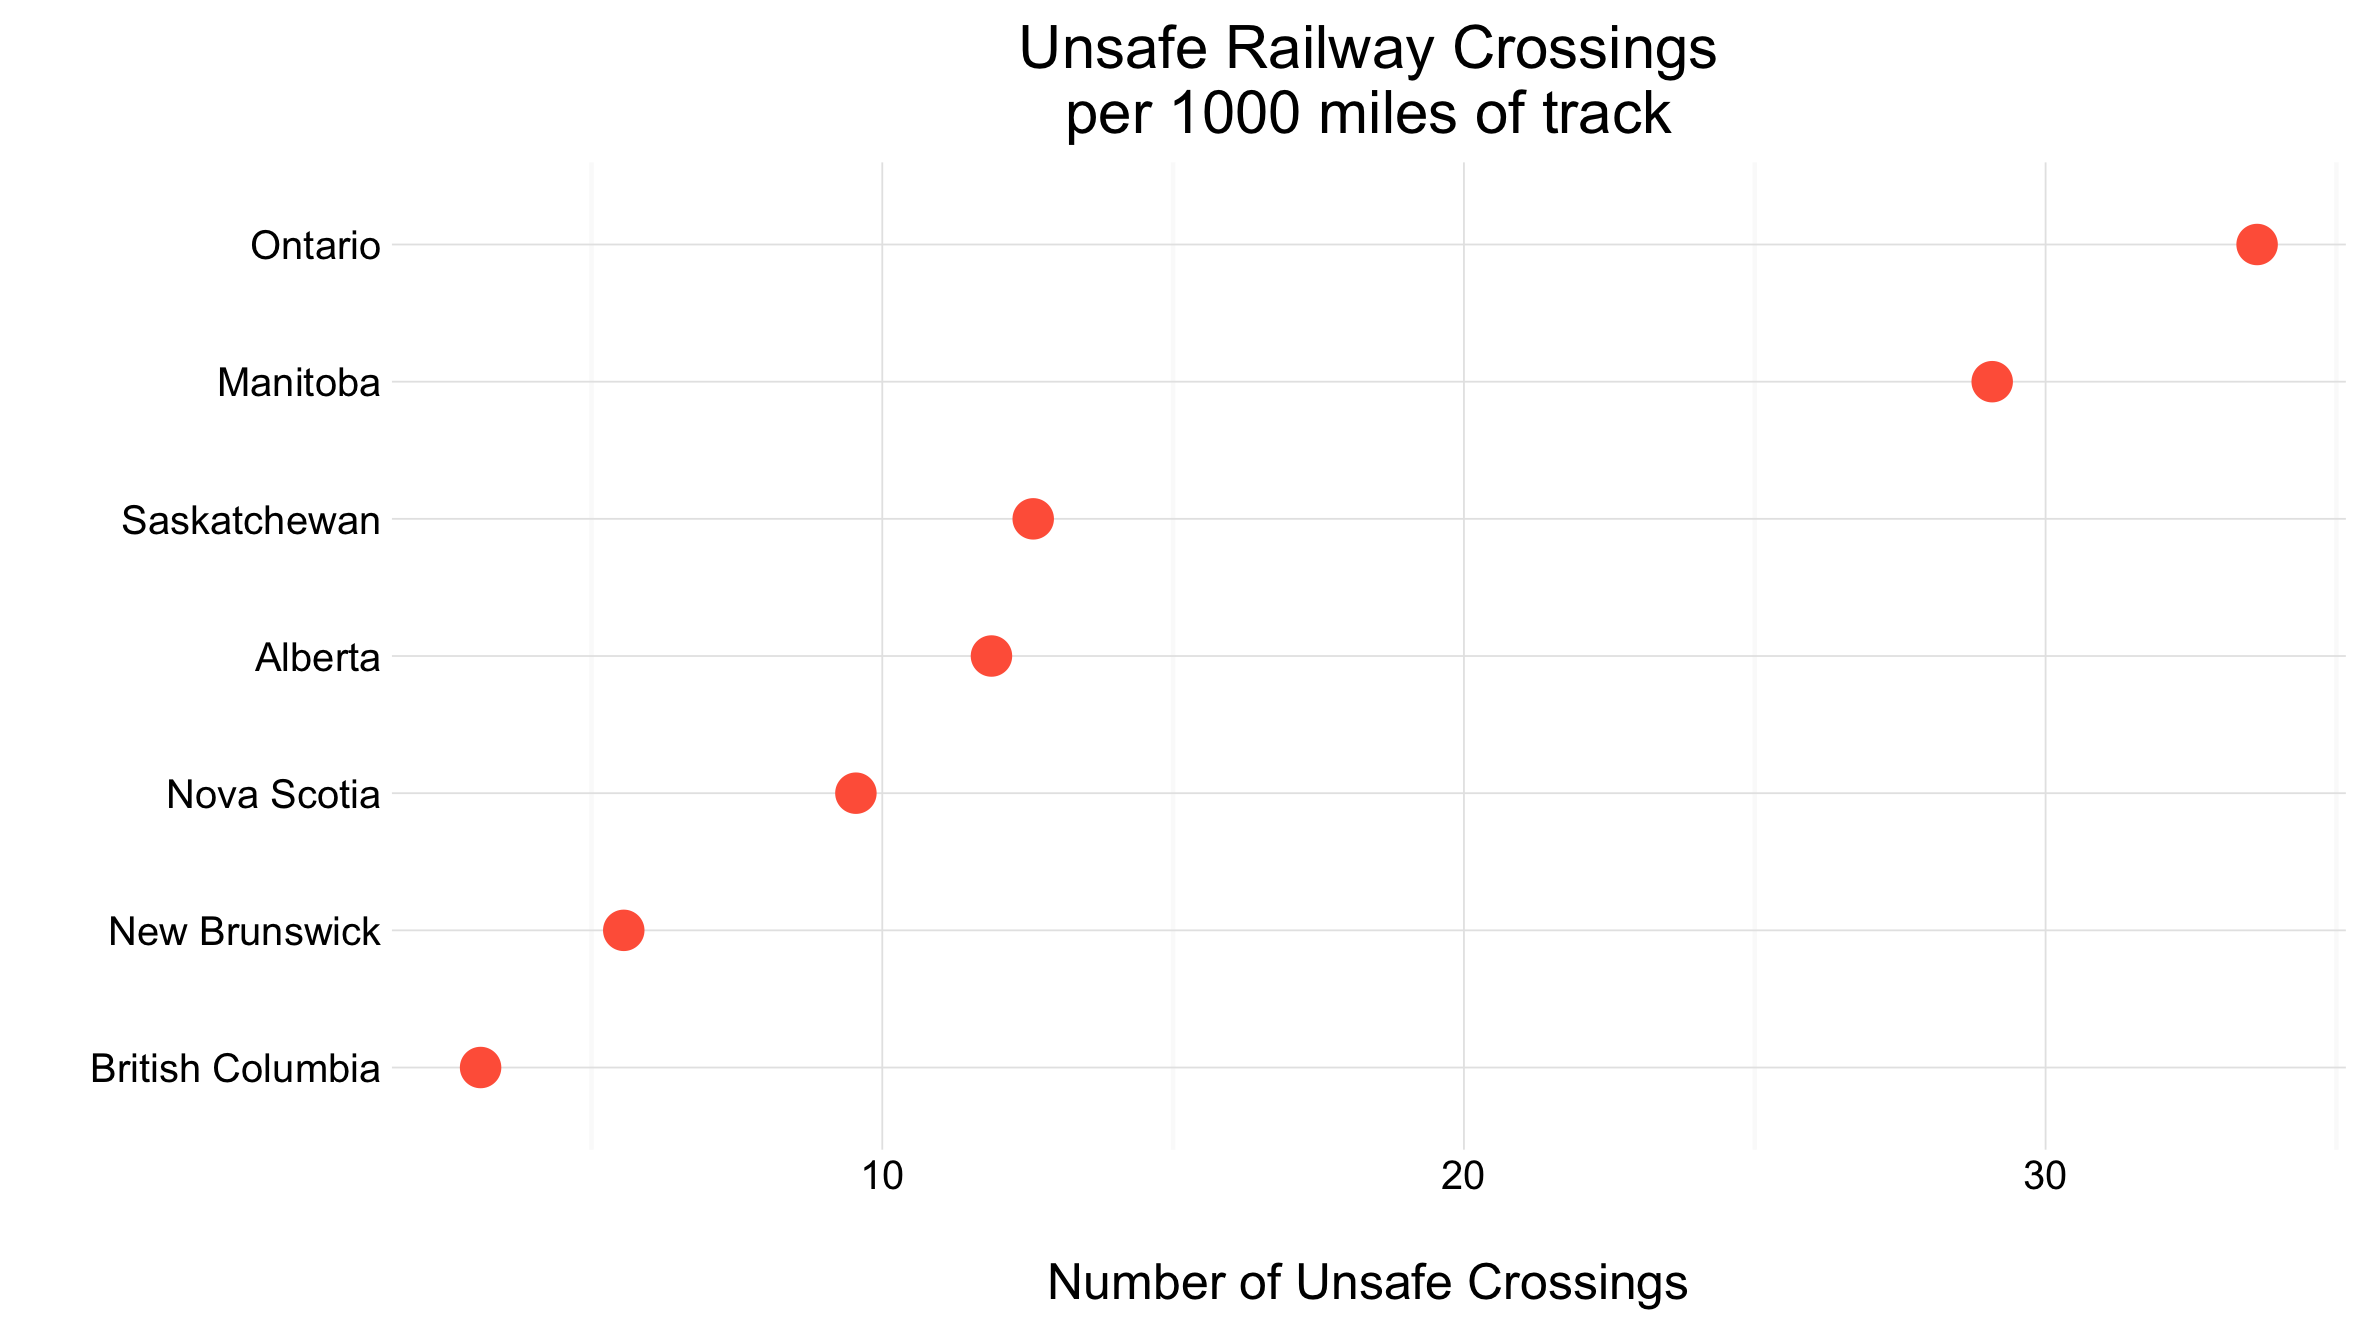
Canada’s 500 Most Dangerous Train Crossings
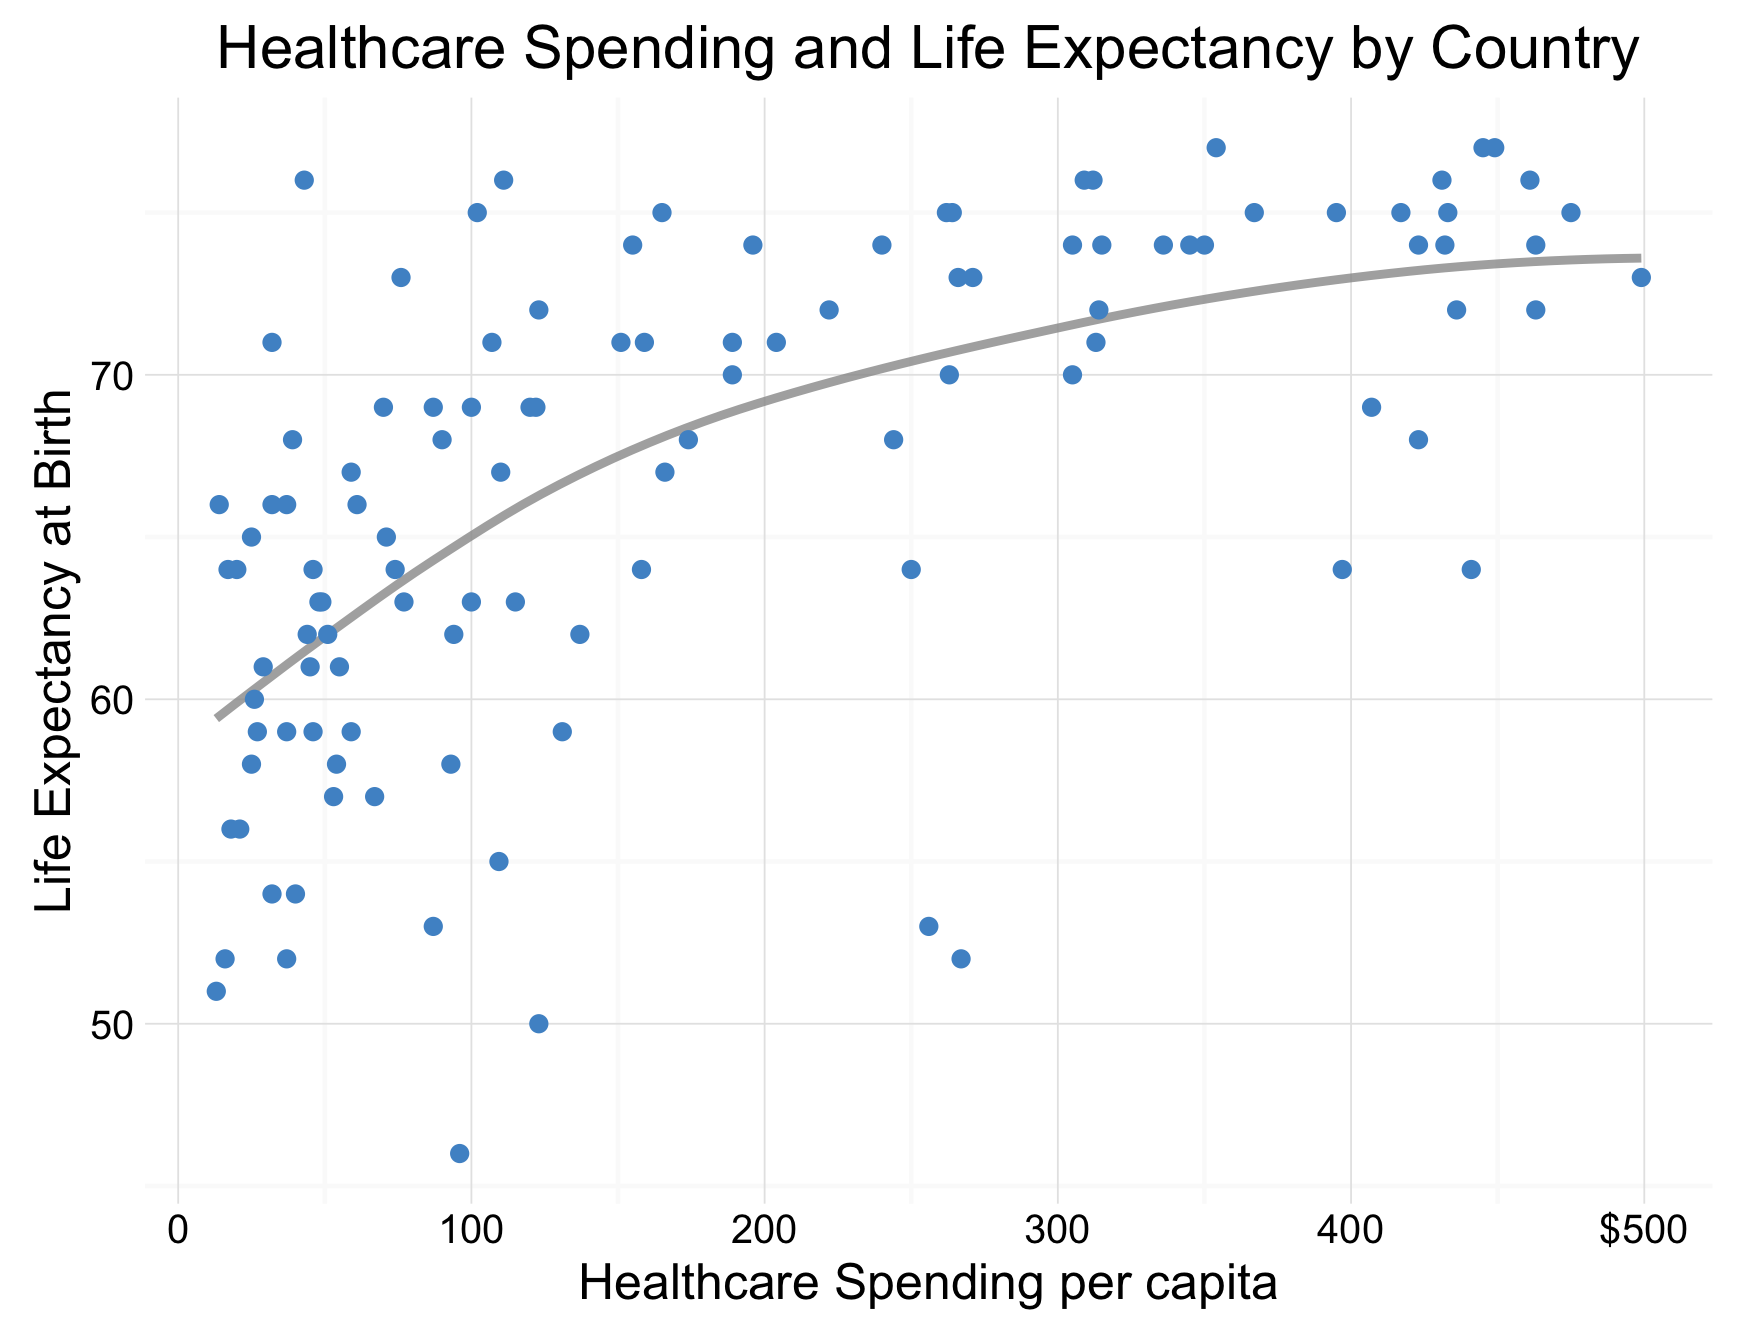
WHO Healthcare Spending and Life Expectancy
Improved Article Visualization
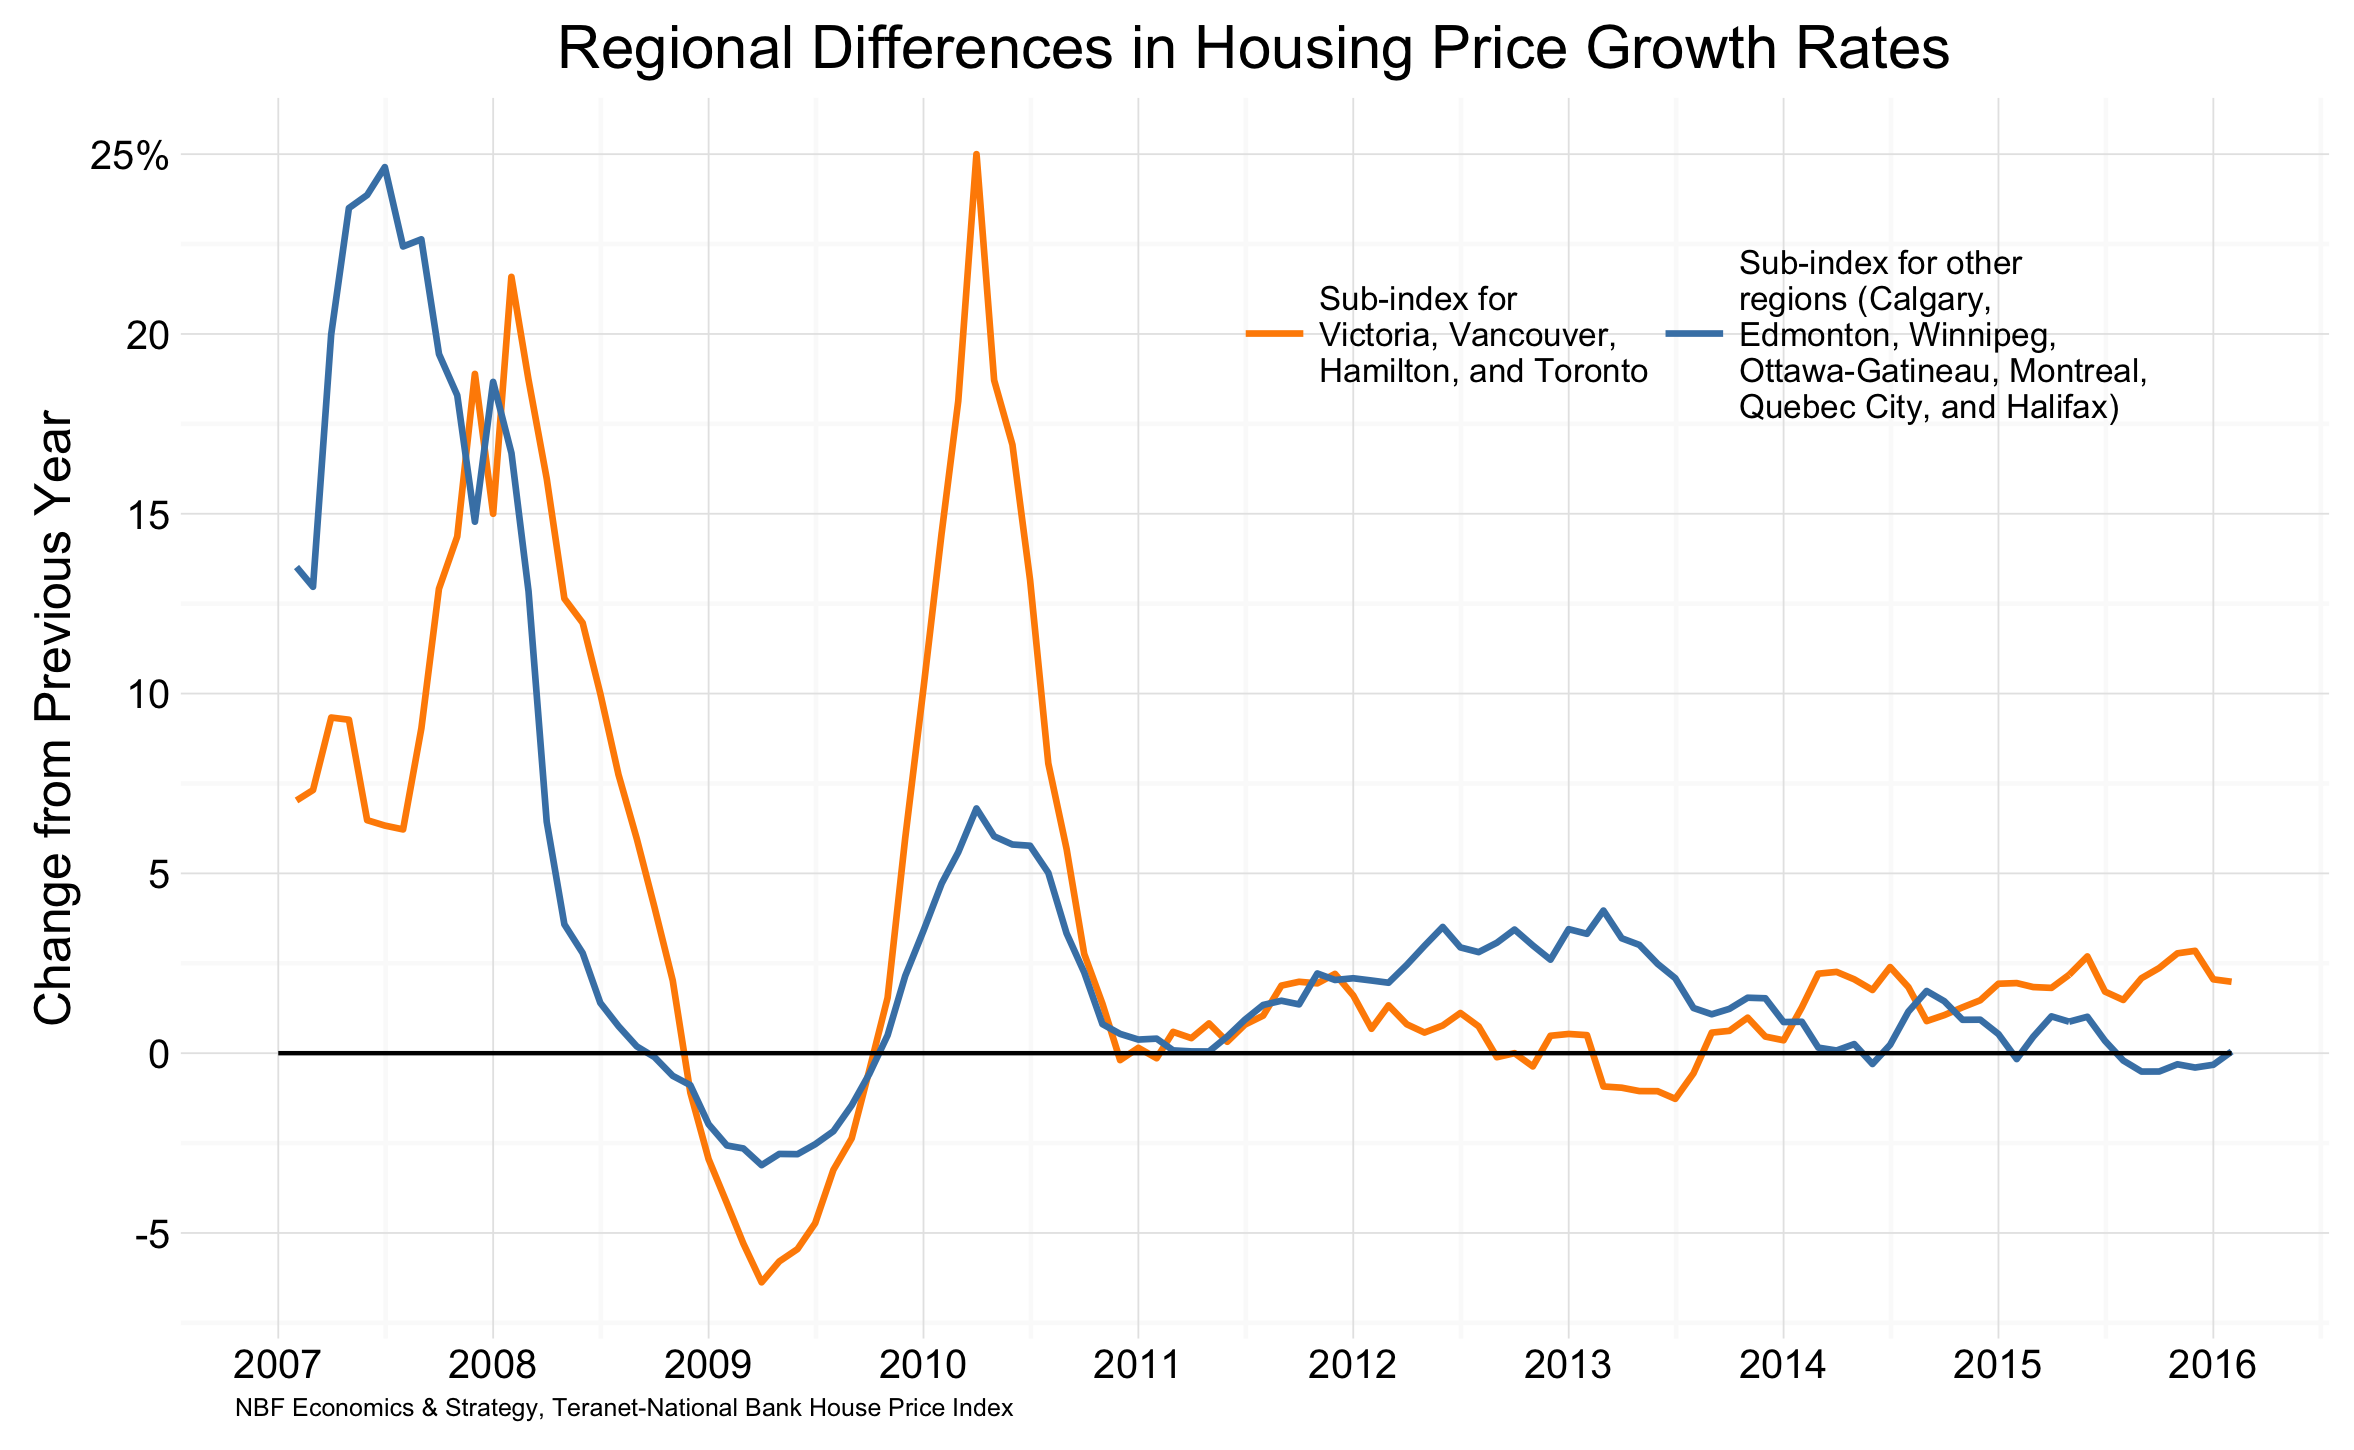
Improved Housing Market Visualization
Footnotes:
-
Wickham, H. (2009). ggplot2: Elegant Graphics for Data Analysis. Springer-Verlag New York. Retrieved from http://had.co.nz/ggplot2/book ↩
-
Wickham, H., & Francois, R. (2015). dplyr: A Grammar of Data Manipulation. Retrieved from https://CRAN.R-project.org/package=dplyr ↩
-
Csardi, G., & Nepusz, T. (2006). The igraph software package for complex network research. InterJournal, Complex Systems, 1695. ↩
-
Wickham, H. (2007). Reshaping Data with the reshape Package. Journal of Statistical Software, 21(12), 1–20. ↩
-
R Core Team. (2015). foreign: Read Data Stored by Minitab, S, SAS, SPSS, Stata, Systat, Weka, dBase, … Retrieved from https://CRAN.R-project.org/package=foreign ↩
-
Few, S. (2012). Show Me the Numbers: Designing Tables and Graphs to Enlighten (2nd ed.). USA: Analytics Press. ↩